|
EngMod4T Post4T - The post processing software |
![]()
|
Post4T: Crank-Angle or Degree Based Output. Selecting to display "Thermo- and Gasdynamic Traces" from the main menu opens the following dialog box:
The top left lists the 8 types of trace files that can be selected:
|
The following graphs are just a small example of the outputs that are available.
The following is a sample of pressure traces. It shows the inlet port, cylinder (limited to 3bar) and exhaust port pressures for cylinder 4 of a 1000cc Mini engine with port event lines, valve lift profiles and the maximum piston speed line included:

This figure shows the mach traces for the exhaust port of cylinder 4 of the 1000cc Mini engine. The three traces show the mach values through the valve opening (ExVMach), the smallest cross section of the port (ExPMach) and about a 100mm (user defined position) from the valve head (ExMach). It shows that the flow past the valve is sonic for an extended period of time.

The in cylinder temperatures are shown. The black line shows the mean temperature inside the cylinder (CylTemp), the red line the temperature of the unburnt mixture (TUnBurnt), and the green line shows the burnt mixture temperature (TBurnt). It is also possible to display the temperature in any point of any plenum or duct.

This shows the left and right moving waves at the exhaust valve, which explains why they are the same when the valve is closed. Note how the blowdown pulse (PepRight) differs from the reflected pulse (PepLeft) during the valve open period.

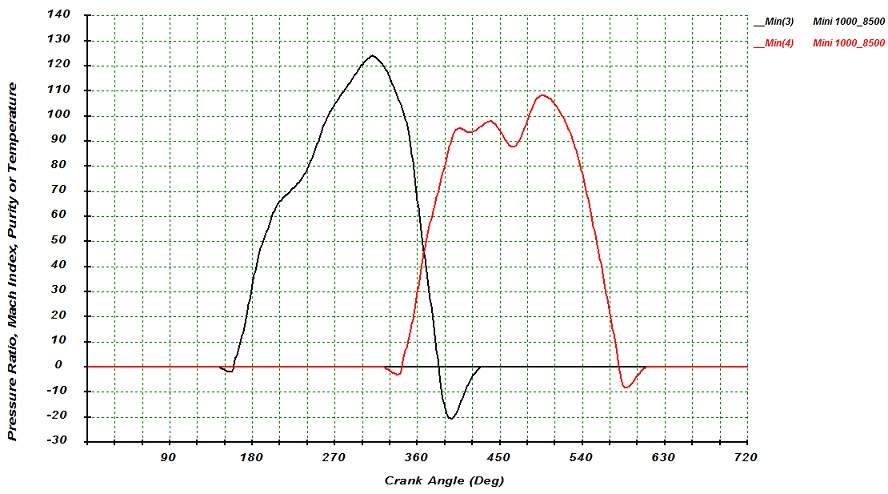
The purity of cylinder 3 and 4 of the Mini 1000 with the siamesed inlet ports are plotted with both referenced to each cylinder's TDC. This shows that at inlet valve closing (IVC) the purity in the cylinders are the same, meaning the performance difference between the two cylinders are not the result of one scavenging better than the other.

The traces shown here are the mass of unburnt gas, the mass of enflamed mixture and the mass of burnt mixture during turbulent combustion.

This shows the mass flow in the inlet ports of cylinder 3 and 4 of the Mini 1000cc engine. This engine has siamesed inlet ports with the ports of cylinder 1 and 2 and cylinder 3 and 4 siamesed. It shows clearly how the suction of cylinder 4 is beginning to reverse the flow in cylinder 3 inlet port during its closing period.
To compare the mass flow of the two ports they are plotted over each other. By comparing the two curves one can see how port 3 influences the flow in port 4 and later how port 4 influences the flow in port 3.

This shows the pressure ratios across the the compressor and the turbine and waste gate.

![]()
Copyright © Vannik Developments. All rights reserved.
